By hostmyai October 14, 2025
Modern teams deploy models faster than ever—but sustained business value comes only when those models are continuously observed, measured, and improved. Effective monitoring catches data drift, concept drift, model performance regressions, latency spikes, cost blow-ups, and fairness issues before they harm users.
In the cloud, you also inherit elastic infrastructure, managed services, and rich telemetry—so your monitoring strategy should embrace cloud-native patterns while remaining portable across providers.
This guide compiles best practices for monitoring AI models in the cloud, blending platform-agnostic principles with provider-specific capabilities from AWS, Google Cloud, and Azure. It also covers open-source options (Evidently, MLflow, Prometheus/Grafana) that many teams use alongside managed stacks.
Throughout, you’ll find practical checklists, design decisions, and “gotchas” learned the hard way by high-scale teams. Our goal is an updated, actionable, and easy-to-apply playbook you can adapt for tabular ML, classical NLP/CV, and GenAI/LLM applications.
Why Cloud-Native Model Monitoring Is Non-Negotiable
Monitoring is the backbone of reliable AI. In production, your model is exposed to non-stationary data, evolving user behavior, and ecosystem changes (APIs, partners, regulations). Even a highly accurate model at T0 can degrade as inputs shift.
Two core phenomena drive this decay: data drift (distributional shifts in inputs) and concept drift (changes in the relationship between inputs and labels). Detecting and localizing these shifts early lets teams stage mitigations: trigger retraining, roll back, route traffic, or escalate to on-call.
Open-source resources widely document the impact and detection strategies for drift, including how prediction drift can act as a proxy when you lack labels.
Cloud-native monitoring compounds these needs with platform benefits. Managed services like Amazon SageMaker Model Monitor perform scheduled checks for data quality, bias, and feature-attribution drift directly against captured inference traffic and can raise alerts when thresholds are exceeded.
Vertex AI Model Monitoring records online prediction payloads to BigQuery and supports skew/drift detection per feature; it can also monitor feature attribution skew/drift via Vertex Explainable AI, which is powerful for debugging models in dynamic environments.
Azure Machine Learning provides built-in signals—data drift, prediction drift, data quality, model performance, and feature attribution drift—and can run scheduled monitoring jobs with alerting.
These offerings underscore that best practices for monitoring AI models in the cloud should harness native telemetry and alerting instead of bolting on ad-hoc scripts.
Designing an End-to-End Monitoring Architecture
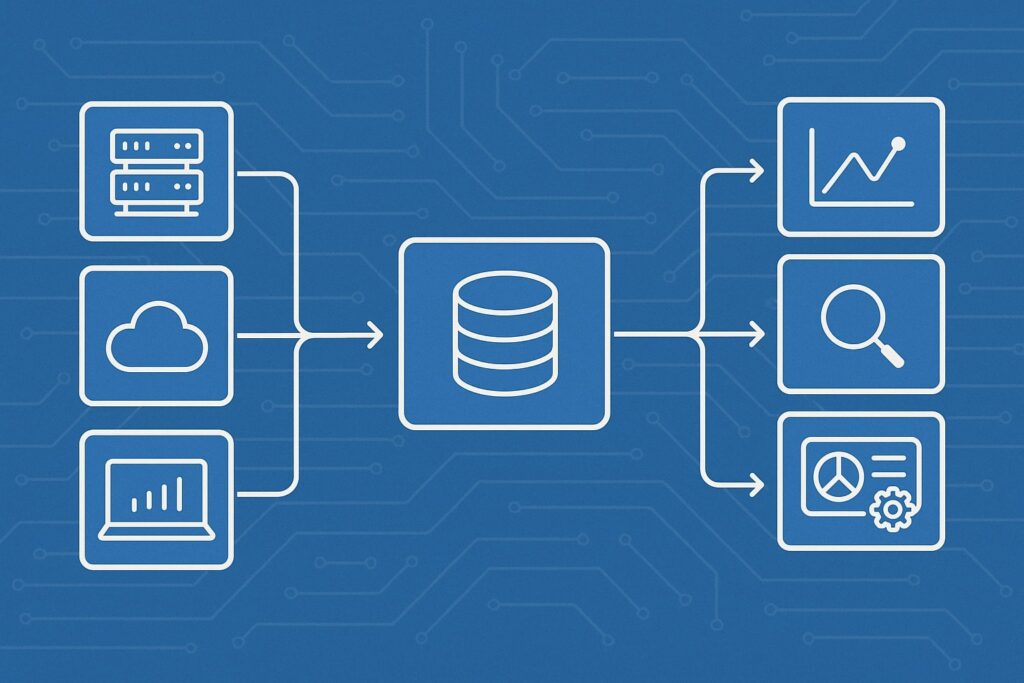
A robust architecture blends data capture, metrics computation, thresholding & alerting, and action orchestration. First, decide what to log at inference time: request IDs, timestamps, model/version, features (raw and engineered), predictions, confidence scores, and latency.
For online endpoints, enable server-side data capture (e.g., SageMaker data capture or Vertex logging to BigQuery) to minimize client overhead and ensure completeness. Then build an ETL/ELT path to a queryable store (object storage + lakehouse tables or managed telemetry sinks).
With Google Cloud, incoming prediction requests for monitored endpoints are automatically logged to BigQuery, which simplifies downstream analysis and periodic drift checks.
Azure’s online endpoints can automatically collect inference data and persist it for monitoring jobs. These native data planes reduce custom plumbing and improve reliability.
Next, compute monitoring signals on a schedule. For managed platforms, define jobs for data quality (missing/invalid features), feature drift, prediction drift, model performance (if labels are available), fairness/bias (per protected group), explanations drift, cost/unit economics, throughput & latency, and error rates.
In Vertex AI, you can explicitly enable skew (training vs. serving) when training data is available; otherwise prefer drift (serving vs. serving over time).
In Azure, you specify signals and thresholds and let the service evaluate on your schedule, auto-alerting when breaches occur. This mix keeps your best practices for monitoring AI models in the cloud aligned with provider tooling while remaining portable.
Finally, close the loop: alerts should route to on-call (PagerDuty/Slack/Email), and automations should exist for safe responses—e.g., traffic shifting to a champion model, turning on guardrails (rate limits/max tokens for LLMs), or triggering retraining pipelines.
Many teams complement cloud monitoring with MLflow (for experiment lineage and GenAI tracing) and Evidently (for flexible drift/quality tests and dashboards). Together, they provide end-to-end observability of AI behavior from inputs to business KPIs.
What to Measure: A Practical Metrics Blueprint
Start with data plane metrics: schema conformity, missingness, invalid types, categorical unseen rates, and range/quantile anomalies. Add distributional metrics per feature (PSI, JS divergence, Hellinger, KS).
For model plane metrics, track prediction distributions, confidence/uncertainty, calibration error (ECE), and output constraints (e.g., probability sums). When ground truth arrives (batch), compute performance (AUC, F1, MAE, RMSE) over sliding windows by segment (channel, geography, device).
For fairness, use disparity metrics across sensitive attributes; for explainability stability, monitor feature attribution drift (e.g., SHAP value distributions) which Vertex supports natively. Tie all of it to SLOs/SLAs—latency percentiles, error budgets, and cost per 1k predictions—so alerts map to user impact.
For GenAI, extend the blueprint: token usage/cost, latency, hallucination proxies (groundedness scores via retrieval overlap), toxicity/PII leakage, prompt/response length, and tool-call success rates.
Use human-in-the-loop review queues for a sampled subset and store traces to analyze failures. MLflow’s production tracing targets exactly this for GenAI applications, enabling iterative quality improvements with rich spans and metadata.
Open-source frameworks like Evidently now include LLM-focused checks, letting you validate prompt pipeline health alongside traditional drift.
Data Capture and Governance: Getting the Foundation Right
Reliable monitoring requires high-fidelity logs. Use server-side capture to prevent client omissions; ensure logs include model identity (model name, version, commit/registry hash), feature lineage (transforms applied), and privacy flags.
In AWS SageMaker, Model Monitor builds on endpoint data capture and lets you schedule baseline and monitoring jobs (data quality, model quality, bias drift, attribution drift).
In Google Cloud, monitored endpoints store requests in BigQuery, and in Azure, online endpoints collect inference data automatically. Standardize a log schema (Avro/Parquet) and enforce it via contracts in CI/CD to prevent silent drift.
On governance, apply data minimization and masking for PII. Segment logs by tenant/region to respect data residency. For LLMs, redact secrets and private keys before logging. Configure retention policies and access controls (IAM, VPC-SC/boundary per GCP, AWS IAM, Azure RBAC) so observability doesn’t create risk.
Build replay tooling to reproduce problematic requests; this accelerates debugging and makes your best practices for monitoring AI models in the cloud operational rather than aspirational.
Thresholds, Alerts, and On-Call Runbooks
A monitoring system is only as good as its actionable alerts. Avoid generic “drift detected” pings; instead, alert with context: which feature drifted, by how much, since when, scope of impact, and suggested next steps.
Use baselines (training distributions) plus adaptive thresholds (rolling quantiles) to reduce false positives. Configure multi-level severity: warn on small PSI > 0.1, page on PSI > 0.25 for critical features; for latency, warn at p95 > target, page at p99.9.
In managed stacks, you set custom thresholds and schedules; Azure’s model monitoring, for example, lets you specify signals and thresholds, runs jobs on a cadence, and triggers notifications with links to detailed results.
Every alert needs a runbook: steps to validate the signal, diagnostic queries (e.g., feature slice breakdowns), a mitigation menu (rollback to champion, reduce traffic, enable guardrails, clamp inputs), and an escalation path.
Store runbooks next to alerts (annotations in Grafana, links in CloudWatch/Monitoring dashboards). Treat runbooks as living documents that improve after each incident.
Detecting and Handling Drift (Data, Concept, Attribution)
Data drift is a change in input distributions; concept drift is a change in the input-to-label relationship. Data drift may not always hurt accuracy—but it’s a strong early warning.
Use PSI or KS tests to flag shifting features; couple this with prediction drift to prioritize exploration. Evidently’s guides detail when and how to combine these signals, and why prediction drift helps when labels lag.
For concept drift, rely on delayed performance (once labels arrive) and proxy indicators: calibration shift, confidence entropy, and attribution drift. Feature attribution drift indicates the model is relying on different signals than expected; Vertex AI supports monitoring attribution skew and drift using Explainable AI integrations.
In SageMaker, feature attribution drift is also part of Model Monitor’s capabilities for real-time endpoints, enabling you to catch subtle model behavior changes even when headline metrics look stable.
Azure monitors feature attribution drift as a built-in signal. These cloud features let you triangulate drift from multiple angles and respond with confidence.
Monitoring for Fairness, Safety, and Compliance
As models influence decisions, fairness and safety must be first-class monitoring concerns. Track performance and error rates across protected groups (e.g., gender, ethnicity, region) and important slices (tenure, income bands).
Add bias drift jobs: are disparities widening? Are once-rare edge cases becoming common? In managed stacks, you can run bias or attribution-drift checks; SageMaker includes bias drift monitoring and Azure offers per-slice metrics when you configure appropriate signals and datasets.
Map findings to policies: thresholds that, if breached, halt deployment, trigger manual review, or activate stricter guardrails.
For GenAI, define safety rails (toxicity, PII leakage, jailbreak attempts, hallucination proxies). Continuously evaluate prompts/responses with automated classifiers and periodic human review. Keep auditable logs of interventions (blocked prompts, redactions, tool denials).
Build compliance reports—who changed thresholds, when a model was rolled back, what evidence justified the change. This not only strengthens user trust but also readies you for regulatory inquiries and partner audits.
Observability for LLM and GenAI Systems
LLMs introduce multi-step pipelines: retrieval, prompt construction, tool calls, and response synthesis. Traditional “request/response” metrics are not enough. Instrument traces that capture each step—input prompt, retrieval candidates, model calls, tool outputs, and final response—with durations and intermediate errors.
MLflow’s production tracing provides observability tailored to GenAI applications, enabling iterative improvements and robust QA. On top of traces, log token usage, cost per request, cache hit rates (for prompt caching), and guardrail actions.
Build evaluation harnesses: offline checks (groundedness vs. context, factuality against reference datasets), online A/Bs, and post-deploy quality sampling with human-in-the-loop adjudication.
Link these evaluations to alerts: if groundedness drops below a threshold or safety violations spike, page the on-call and automatically tighten guardrails (shorten context, restrict tools, or route to a safer model).
Cloud-Specific Tactics You Should Actually Use
On AWS, enable SageMaker data capture for your endpoints and configure Model Monitor jobs for data quality, model quality (if labels are available), bias drift, and feature attribution drift.
Visualize in SageMaker Studio; route alerts via CloudWatch/CloudWatch Alarms. Document MonitoringBaselineConfig and refresh baselines after retrains.
On Google Cloud, turn on Vertex AI Model Monitoring for feature skew/drift and attribution skew/drift; logs land in BigQuery, which simplifies ad-hoc analysis and dashboarding (Looker Studio).
Use v1 for managed skew/drift and explore v2 notebooks for custom monitoring flows—including monitoring models outside Vertex or batch jobs—ensuring portability across deployments.
On Azure, if you deploy via online endpoints, data collection is automatic. Use model monitoring (v2) to select signals (data drift, prediction drift, data quality, feature attribution drift, model performance), choose thresholds, and set schedules.
Azure will run monitoring jobs and trigger alert notifications with deep links to results, which is excellent for on-call response.
Across clouds, pair managed services are open-source: Evidently for extensive drift/quality tests and dashboards; MLflow for lineage, metrics, and GenAI traces; Prometheus/Grafana for system metrics and SLO dashboards. This hybrid gives you cloud leverage + vendor-neutral portability.
Building Dashboards that Drive Action (Not Just Pretty Charts)
Dashboards should help someone answer questions quickly: Is the model healthy? If not, where and why? Organize by layers:
(1) Executive: green/red status of core KPIs (accuracy proxy, latency, cost, safety),
(2) On-call: current incident view with context,
(3) Engineer/Scientist: drill-downs with feature-level drift, slice performance, and recent code/model changes.
Ingest signals from cloud monitors and OSS (Evidently/MLflow) into a unified pane (Grafana/Looker/Quicksight/Power BI). Add annotations for deployments and dataset refreshes so regressions correlate with events.
Make dashboards slice-first: top segments by traffic and risk. Include latency histograms, tail percentiles, and throughput. For GenAI, place token cost, cache hit rate, guardrail block rate, and tool-call failure rate on page one.
Tie every chart to a playbook link so responders know the next step. This is how best practices for monitoring AI models in the cloud become muscle memory.
Automating the Feedback Loop: From Alerts to Retraining
Monitoring without automated response is half a solution. Establish policies such as: when PSI on any critical feature exceeds 0.25 for 24 hours or model AUC drops >2 points week-over-week, trigger retraining and stage a canary.
Use your MLOps platform (SageMaker Pipelines, Vertex Pipelines, Azure ML Pipelines, or OSS like Kubeflow/Prefect) to orchestrate: data snapshot → training → evaluation → bias/safety checks → registry versioning → canary deploy → automatic promotion if SLOs pass.
For LLMs, automate RAG index refreshes, prompt template updates (gated), and fine-tune jobs if quality drops. Keep a human approval step for risky changes. Ensure all automated jobs emit events that become dashboard annotations and that rollbacks are one click or one command.
Cost, Performance, and Sustainability Monitoring
Cloud bills can spike silently with traffic surges, inefficient prompts, or large batch jobs. Track cost per prediction, cost per 1k tokens, GPU hours, and egress. Alert when costs deviate from baselines.
For performance, chart p50/p95/p99 latency and watch the p99.9 tail—that’s where user pain lives. Consider adaptive batching, dynamic max tokens, quantization, or smaller models for certain segments when latency breaches SLOs. Sustainability matters too: monitor GPU/CPU utilization, idle time, and job right-sizing to reduce waste.
Security and Privacy Considerations in Monitoring Pipelines
Observability data is sensitive. Enforce least privilege IAM, VPC-only endpoints, private service access, encryption in transit and at rest, and KMS-managed keys. Apply tokenization or redaction to PII before logging; never store secrets in prompts or traces.
Propagate data lineage and consent flags. Regularly audit who can view monitoring dashboards and which logs cross regions. For open-source components, pin versions, scan containers, and monitor CVEs. A secure monitoring plane protects users and your company.
Open-Source vs. Managed Monitoring: Choosing the Right Mix
Managed tools reduce undifferentiated heavy lifting and integrate cleanly with cloud logging and alerting. SageMaker Model Monitor, Vertex AI Model Monitoring, and Azure ML model monitoring give you strong baselines with minimal code.
Open-source shines when you need custom tests, portability, or LLM-specific instrumentation. Evidently offers 100+ metrics/tests and nice dashboards for ML and LLM observability; MLflow brings experiment tracking, model registry, and GenAI tracing for production apps.
In practice, most mature teams combine both—managed jobs for foundational signals and OSS for bespoke analysis and cross-cloud consistency.
Implementation Roadmap: 30-60-90 Days
Days 0–30: Foundation
- Turn on inference data capture for all online endpoints; standardize a log schema.
- Stand up a central metrics store (BigQuery/Parquet Lakehouse) and dashboards with executive and on-call views.
- Enable baseline monitors: data quality, feature drift, prediction drift, latency, error rate, cost.
Days 31–60: Depth
- Add attribution drift, fairness slices, and calibration checks.
- Integrate alerting with runbooks and begin post-incident reviews.
- For GenAI, implement tracing, safety classifiers, and groundedness evaluations.
Days 61–90: Automation & Scale
- Define policies to auto-trigger retraining, RAG refresh, or traffic shifts.
- Harden security & privacy controls; add SLO error budgets.
- Build canary + shadow deploy patterns to validate changes safely.
This staged approach makes best practices for monitoring AI models in the cloud attainable for small teams and scalable for enterprises.
FAQs
Q1. How do I monitor models when I don’t have labels?
Answer: Use unsupervised signals: data quality, feature drift, prediction drift, calibration shift, and feature attribution drift. Vertex AI and Azure can run these on schedules; SageMaker supports similar jobs. When labels become available, backfill performance metrics and compare to your proxies to refine thresholds.
Q2. How often should monitoring jobs run?
Answer: Match cadence to risk and traffic. High-traffic user-facing APIs: every 15–60 minutes for drift/predictions; hourly to daily for attribution/fairness; daily to weekly for performance (labels). Batch models: per batch plus a daily summary. Use rolling windows to balance signal and noise.
Q3. What’s the difference between skew and drift?
Answer: Skew compares training vs. serving distributions; drift compares serving over time. You’ll use skew when you have the training dataset handy (Vertex AI supports this), and drift when you care about changes across production windows. Many teams monitor both.
Q4. How do I handle false positives?
Answer: Adopt per-feature thresholds and adaptive baselines. Require persistence (e.g., breach for N consecutive windows) before paging. Add business context (traffic volume, segment impact) to alert logic.
Q5. Can I monitor models deployed outside my cloud provider’s endpoints?
Answer: Yes. Vertex AI provides v2 patterns to monitor models outside Vertex; Azure supports external deployments if you collect inference logs; and open-source stacks (Evidently + MLflow + Prometheus/Grafana) can run anywhere.
Q6. What should I track for GenAI/LLMs?
Answer: Token use & cost, latency, cache hit rate, safety violations, tool-call success, hallucination proxies/groundedness, and traces for each pipeline step. MLflow’s production tracing is designed for this use case.
Q7. How do I prove compliance?
Answer: Maintain auditable logs of model versions, thresholds, alerts, and responses. Store evaluation artifacts, bias reports, and human review outcomes. Use provider dashboards and OSS reports (Evidently) as evidence trails.
Conclusion
Sustained impact from AI hinges on continuous, cloud-native monitoring. The playbook is clear: capture the right data, compute meaningful signals (drift, performance, fairness, attribution, latency, cost), set actionable thresholds, and connect alerts to runbooks and automations.
Lean on your cloud’s managed monitors for speed and reliability, and augment with open-source for flexibility and depth. Treat LLMs as multi-step systems that need tracing and safety oversight, not just accuracy checks.
Above all, make monitoring a first-class product capability, not an afterthought. Teams that adopt these best practices for monitoring AI models in the cloud catch regressions early, ship confidently, and build trust with users and regulators alike.